
Earlier this year, Vibrant Planet's core vegetation structure model, VibrantVS, achieved an industry milestone by more accurately predicting canopy heights than other industry benchmark models. We've now applied VibrantVS to reach another significant industry breakthrough: mapping nearly every dominant and co-dominant tree across California’s massive, ecologically diverse 100+ million acres. In total, we mapped more than two billion trees–2,183,883,798 to be exact.
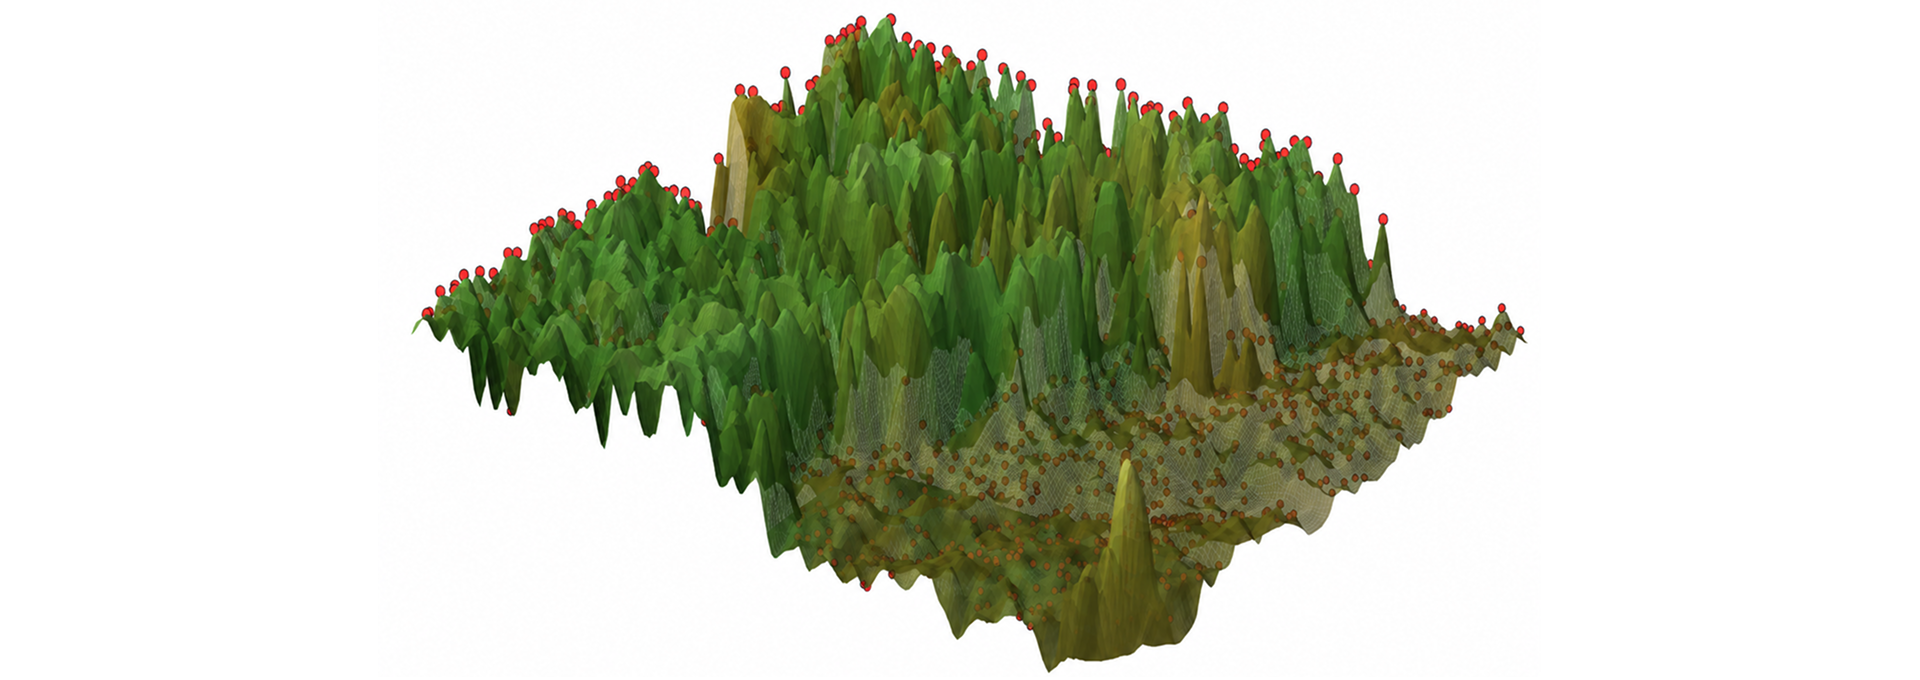
We did this by deploying VibrantVS to generate a fine-scale canopy height model that predicts nearly every dominant and co-dominant tree (which together make up the forest canopy, diagrammed below) across the state.

VibrantVS helps land managers prioritize and plan faster, with better data
Because dominant and co-dominant trees underpin vital ecological functions such as biodiversity, hydrology, carbon storage, and forest productivity, land managers can use this data to inform several economic and ecological workstreams:
- Timber harvest potential: Because estimates of dominant and co-dominant trees from VibrantVS are conservative, land managers can confidently identify forest treatments in areas that will contribute to resilience goals while helping offset project costs through harvested wood.
- Strategic fuels reduction: In areas where our treatment recommendations call for thinning and prescribed fire, land managers can develop plans that quantify biomass outputs, avoided costs from future fires, and benefits from enhanced ecosystems (e.g. recreation, water quality, biodiversity, etc) to justify the cost of treatment.
- Enhanced ecosystem understanding: Accurate distribution mapping of individual trees by size class serves as a powerful indicator of overall landscape health and resilience, and in the future, can be used to predict habitat suitability.
- Water resource optimization: Trees significantly influence watershed dynamics, affecting water yield, snowpack retention, and runoff timing. Fine-scale mapping supports more accurate water resource planning, crucial for both ecosystem health and community water security.
Now, land managers can access this crucial data and build treatment plans faster and with greater confidence, knowing it's powered by VibrantVS's proven accuracy and seamlessly integrated within Vibrant Planet's comprehensive project planning platform.
How VibrantVS predicts the forest canopy
VibrantVS transforms aerial and satellite imagery into detailed tree-level maps with remarkable precision. The technology first leverages LiDAR data to identify individual tree crowns within the canopy (the red points pictured above), and then trains a machine learning model that generates synthetic canopy height maps from widely available aerial imagery—effectively "seeing" canopy-dominant trees across California's diverse landscapes without LiDAR. This innovative approach allows Vibrant Planet to identify dominant and co-dominant trees whenever and wherever the imagery is available. The result is the first comprehensive map of California's trees at an unprecedented 0.5-meter resolution:

Gathering this level of detail is a significant lift – for example, it requires our platform to process 3600 times more datapoints than mapping a landscape to the 30 meter level. The use of aerial, satellite and other 2D imagery enables us to “refresh” stale LiDAR, as well as fill in the many gaps between LiDAR-mapped areas, to “see” the conditions of trees currently and continuously across space. And our model can produce updated maps of canopy-dominant trees whenever needed, across California and far beyond.
Better data and visibility to drive wildfire mitigation and ecosystem health interventions
Outputs like these from VibrantVS are fundamental to our platform, helping calculate hundreds of ecosystem metrics, segmenting the landscape into potential treatment units, and ultimately delivering what matters most: prioritized, collaboratively-designed wildfire mitigation strategies and resilience plans. Without the accurate and efficient canopy height modeling from VibrantVS, land managers would need to rely on costly and time-consuming LiDAR flights to understand their landscapes, or work with inaccurate data scaled down from lower resolution sources that requires costly and time-consuming levels of fieldwork to make usable.
“As a land manager, I was handed datasets downscaled from lower resolution sources and saw lakes that were covered with trees and owl protected activity centers in parking lots. It wasn’t data we could lay out a plan with. Out of necessity, I created my own data sets which then meant I was working in a silo, disconnected from landscape and national scale priorities. This process illuminated the need for our industry to operate out of one common operating picture, and we’re excited to have finally reached this point across all of California,” explains Scott Conway, Vibrant Planet cofounder and Chief Resilience Officer.
Supporting wildfire risk planning in California and beyond
This initiative directly addresses California's growing demand for up-to-date, highly detailed vegetation data to manage wildfire risks effectively and to build robust landscape resilience plans. Unlocking the ability to assess impacts not only at a landscape level, but also in all of our own backyards, is a milestone we’ve been reaching for at Vibrant Planet since our inception. Fire districts, communities, counties, and natural resource managers can now access tailored, unique assessments of landscapes across the entire state of California, with enough accuracy that plans can move directly into environmental analysis, permitting and implementation, cutting years off the traditional timeline. And going forward, we can extend this critical planning infrastructure beyond California to serve these same needs elsewhere in the US and globally.
We're thrilled to have this foundation-level data now readily available for more land managers across California and beyond to develop deeper insights into their landscapes, ecosystems, and surrounding communities—enabling up to date, data-driven decision making that addresses our most pressing environmental challenges.


.png)


.png)