
Seeing How Communities Are Built—and Why It Matters for Wildfire
How fire moves through a community once it arrives is shaped not only by vegetation, weather, and terrain. It is also shaped by how structures are arranged—how close homes sit to one another, how neighborhoods cluster, and how density varies across communities.
This is a dimension of wildfire exposure that traditional risk layers rarely represent explicitly. Most wildfire assessments focus on how fire reaches communities. But research has shown that structure spacing and neighborhood configuration can influence how losses unfold once fire enters the built environment. In many wildland–urban interface (WUI) communities, the built environment itself becomes part of the exposure context.
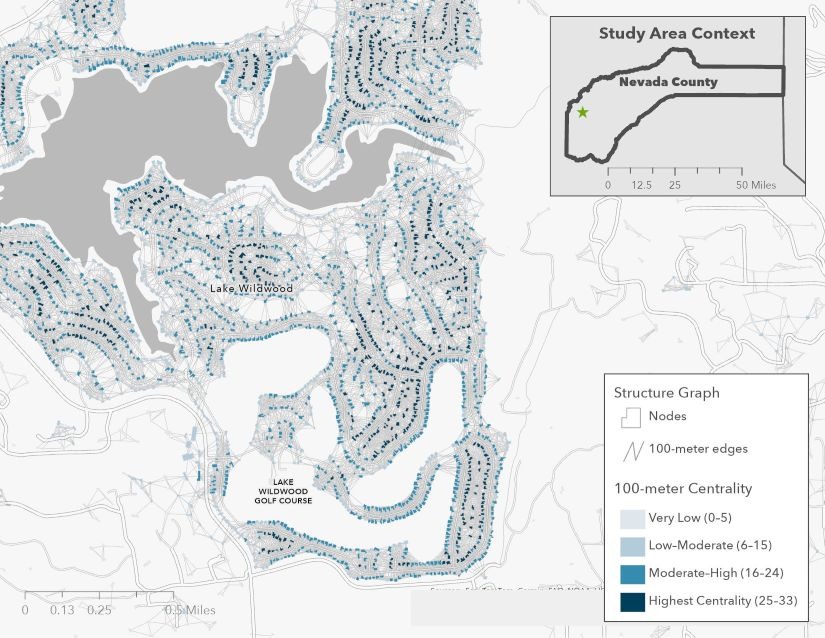
To help make these built-environment relationships visible, Vibrant Planet Data Commons (VPDC) has released and openly shared the California Structure Graph—a statewide dataset describing how California’s approximately 13.6 million structures are positioned relative to one another, based on precise boundary-to-boundary separation distances.
A New Way to See the Built Environment
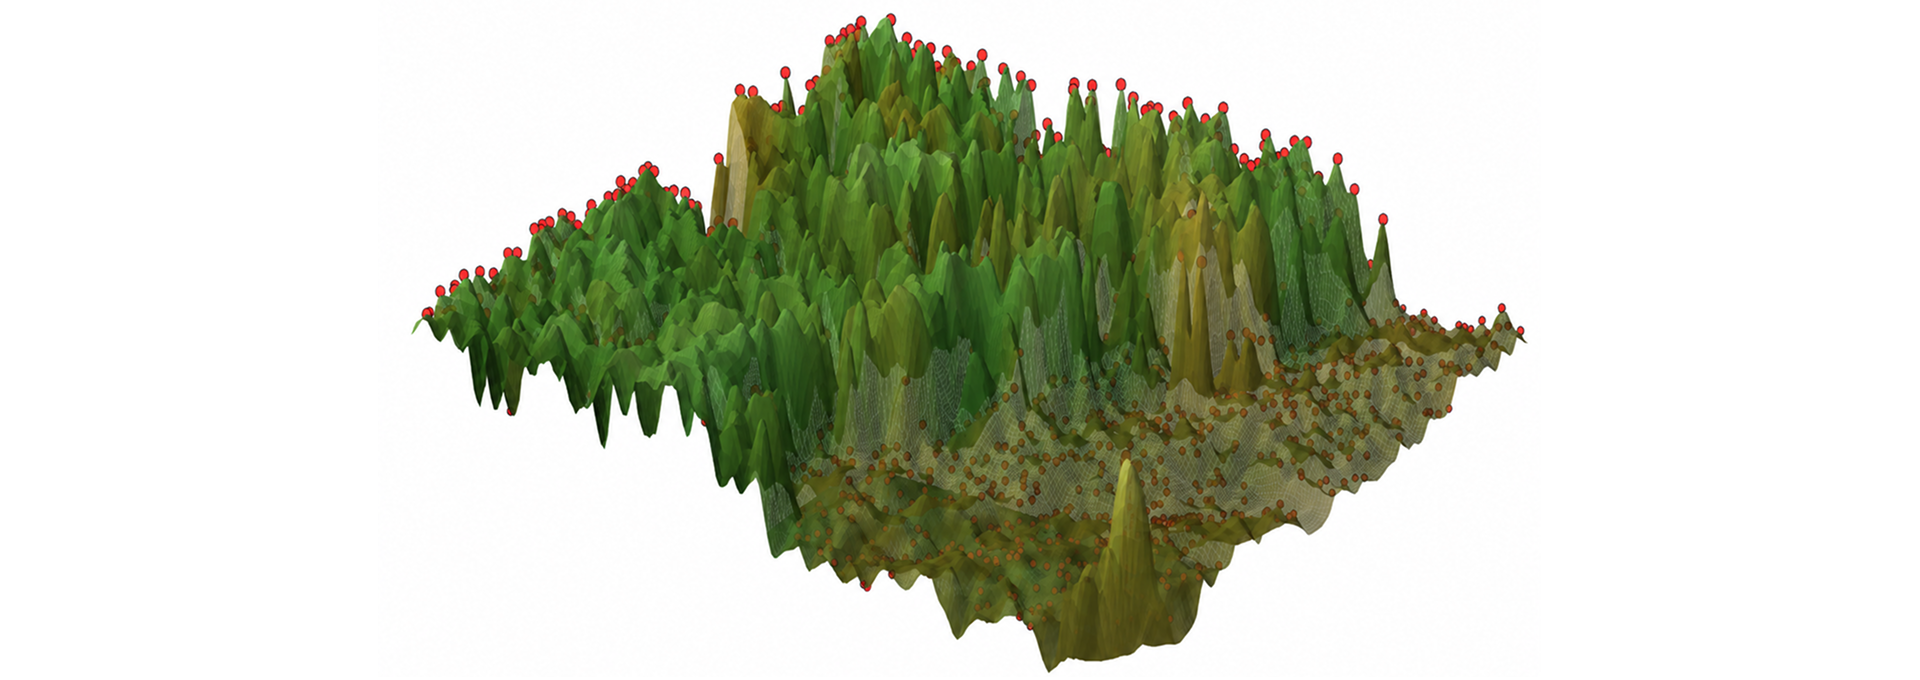
The Structure Graph represents the built environment as spatial networks. Each mapped structure is treated as a node, and connections are recorded between structures that fall within defined separation distances. Exact distances are preserved, allowing users to examine structure proximity and connectivity across multiple scales—from immediate neighbors to broader neighborhood patterns.
This dataset does not model fire behavior, predict losses, or assign risk scores. Instead, the Structure Graph functions as an exposure and connectivity layer: a transparent, reproducible way to describe how community form and structure density vary across the state. When examined alongside existing wildfire hazard and exposure data, it offers an additional perspective on how built-environment patterns differ among communities facing wildfire risk.
Built Through Collaboration
The California Structure Graph was developed by the Pyrologix Wildfire Modeling Team, including Matt Thompson and Bryce A Young, in collaboration with Bogdan State, a Senior Machine Learning Engineer at Vibrant Planet. Using a distributed geospatial processing pipeline, the team transformed large-scale structure footprint data into a statewide network that preserves precise structure-to-structure distances and neighborhood-scale connectivity patterns.
The dataset is published openly through Vibrant Planet Data Commons, where users can read the full data story and access the underlying data for download, extending a commitment to making foundational wildfire science and data accessible to researchers, planners, and practitioners.
What Questions Can It Support?
For forest and fire managers, land-use planners, and researchers, the Structure Graph supports questions such as:
- How tightly clustered are structures within a given community?
- Where do highly connected groups of structures occur?
- How does built-environment connectivity vary across regions facing different wildfire exposure contexts?
- Where might future neighborhoods be located and how might housing configurations reduce potential cascading disasters in fire-prone areas?
- What is the potential liability of utility-caused ignitions, should an urban conflagration be initiated?
- Where can defensible space inspections be prioritized to cover the most homes with the highest risk, given limited resources?
Because the dataset covers the entire state using a single, consistent method, it enables comparison across diverse landscapes—from rural foothill communities to dense coastal WUI neighborhoods.
This connectivity data also serves as a foundational component of Vibrant Planet's ongoing structure risk modeling efforts. By integrating built-environment connectivity with wildland fire exposure, fire likelihood, and structure-level susceptibility, future work aims to translate these spatial patterns into actionable risk information—helping identify where mitigation investments can have the greatest impact.
Explore the Full Data Story
The accompanying data story explains how the dataset was built, the assumptions and limitations involved, and includes an applied example from Nevada County, California. That example illustrates how structure connectivity can be examined alongside wildfire exposure data to explore neighborhood-scale patterns.


.png)


.png)